If you vary the normal load, the battery's "sensitivity" to discharge will change. With a high load there is less noticeable variation in discharge "Sensitivity". The battery's normal discharge rate is so fast it is hard to notice any change. With a cellphone battery that has very low nominal loads, you can tell when a charge only lasts a few days instead of a week. Longer time frames allow for more obvious changes. If you increase the precision of the high load test you can notice the slight changes, but what are a few milli-Amperes among friends.
The main basic flaw in the Climate Science "for the public" definition of "Sensitivity" is that is does separate discharge and charge sensitivity impacts. If you have a steady load, the energy flow to that load varies with the charge state of the battery. As the battery, the oceans charge, the rate of change in the energy flow decreases in a predictable manner if you know the load and the capacity. Since the Sun is the charger which has a fairly constant output, normal solar charge/discharge cycles would be easily predictable at or near the full charge state and would vary with the charging state. Each "wiggle" in the battery voltage would indicate the state of the charge.
Without reliable meters though you can't tell very much though. If the meters are too sensitive you end up with false readings that screw things up. Nice slow meters naturally smooth out the noise which is prefect for a big slow system. If not, you have to slow or smooth the meters to match the timing of the system you are interested in. Since the impact of CO2 on the Ocean Heat Capacity (OHC) is fractions of a degree per century. the blue 0-700 meter World Oceans (WO) vertical temperature anomaly is not very helpful especially when the standard error is about a large as the change over the past 60 years.
Of course any meter should have a tolerance or error specified. According to this portion of the Pacific Ocean vertical temperature anomaly, the Pacific ocean may have warmed 0.05C during the past 60 years or is may have warmed 0.2 C during the past 60 years. Given that the heat capacity of the Pacific Ocean is huge about 0.11 C of warming over the past 60 years +/- 0.1 C is not all that bad.
However, when you look at the estimated change in Pacific OHC with the standard error, things appear too good to be true. In this case the Paleo reconstructions and SST data appear to be more reliable than the new and improved metric for determining Catastrophic Global Warming.
Since the Paleo Mg/Ca derive reconstruction plus every other "Global" metric agrees with a nice steady recharge cycle and not some wild and crazy anthropogenically inspired catastrophe, it might be something is amiss in the Climate Science instrumentation manipulation aka re-analysis procedures.
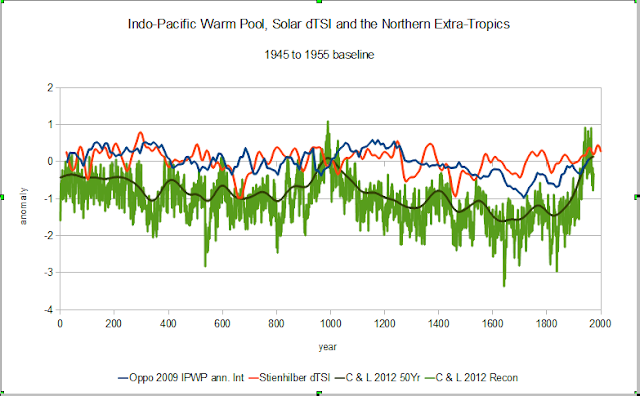
Simply comparing the charge/discharge cycles for a couple of regions with the solar battery charger the only exceptional thing that leaps out is that there was more energy discharged during the most recent cycle. When the high error rage data of paleo climate makes more sense than the new high tech data, it is time to consider Occam's Razor, which is were did we screw up.


No comments:
Post a Comment