

So what good are these "shells"? Each represents a thermodynamic boundary layer. Referencing temperatures to more than one "shell" should make it easier to determine the direction of energy flow. Since solar warms the atmosphere and the surface, but the surface flow is out only, you may be able to pick out some of the less understood atmospheric interchanges. The outer most "shell" the Turbopause is likely the most important. It is the first layer that has little turbulent mixing. For it to be so stable, the combined forces acting upon it have to be perfectly balanced. While it is not shown on the modified atmospheric profile, the Turbopause is roughly located 100 km above the surface with ~99.9% of the mass of the atmosphere enclosed in this "shell".
The purpose of modifying the atmospheric profile is to show what real radiant layers would look like. Not "effective radiant layers" created by averaging the chaotic turmoil of the lower atmosphere.
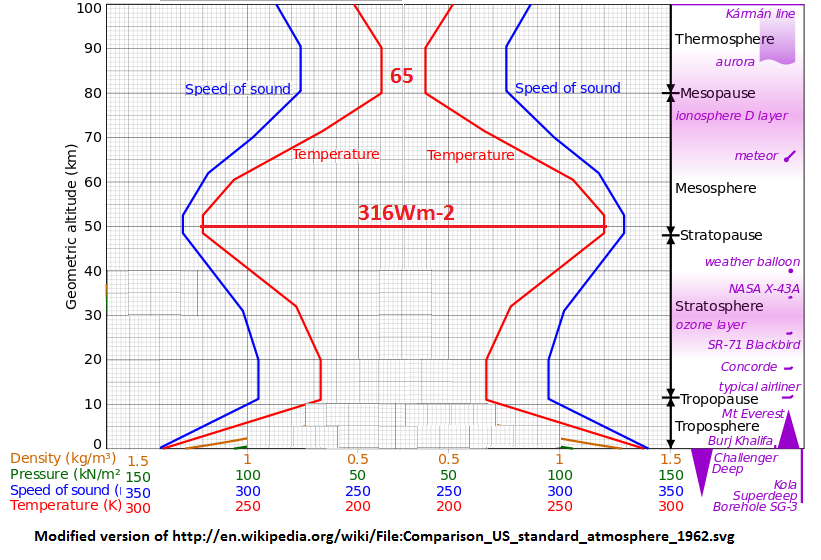
Now, consider again the Carnot Divider in this post. It uses maximum and minimum temperature references to estimate maximum energy transfer efficiencies. The Carnot Divider bounds the systems. The sinks selected, -1.9 C the freezing point of salt water at 35g/kg and the 184k (65Wm-2) minimum atmospheric temperature are real boundary conditions that can be related to the real radiant shells and the real black body, the average ocean temperature of 4C thermocline. No assumptions.
No comments:
Post a Comment